
Welcome to the fourth and final post in my series, DevOps in a Regulated and Embedded Environment. In this part, we’ll look at the problems that pop up when the deploy/test environments aren’t virtualizable. I’m assuming that you’ve already read my earlier post on “Git Flow in a Regulated World”. If you haven’t, the short of it is that regulatory constraints force the software team to maintain multiple long-lived branches as separate streams of development. That is, they can’t just merge to development daily.
Infrastructure Needs
What do we need to test this branch properly? Well, we definitely need one copy of the target environment so we can load a build onto it and run tests. A hardware copy, it can’t be virtualized. Builds still come in fast, and we have to cross-compile to produce a working build for this environment. That means unit tests aren’t running on the Jenkins server, they’re running in the target environment. Combined, this means we’ll need an extra target environment to support rapid feedback unit testing. Yes, we could undertake the development and build infrastructure effort to produce unit test executables that could be run on an x86-64 Linux server. An extra hardware unit is decidedly cheaper.
The count doesn’t stop there though. Automated functional tests also need somewhere to run. We could run them on the first target we were reserving for deployment and smoke testing, but even after automation, the tests might take an hour to run. All incoming builds will be held up waiting on a previous build’s functional tests to finish when those new builds might fail at any earlier point. It’s better to ask for an extra hardware unit so these builds can be failed as soon as possible and reduce cycle time for the team.
Our current tally is at three hardware units: one continuous integration box for deployment and smoke testing, one unit testing box, and one functional testing box. We can argue about the necessity of all three of these targets but there are a few things that make that discussion unproductive. First, these devices are manufactured in house. If there’s enough extra supply, this isn’t a huge deal. On the other hand, this is not the case for every team. In that scenario, you can still look at the cost of purchasing sufficient hardware versus the cost incurred by the development team trying to maintain and release defect laden code. It shouldn’t be hard to justify a ROI for the hardware. There are real productivity gains to be had here. If the development team finds out that a build makes it to functional testing they can frequently just jump ahead and continue working while the functional tests run. Conversely, finding out immediately that your build fails unit tests is similarly useful. Everything we can do to get the development team information about the current health of the build improves the team’s ability to get work done.
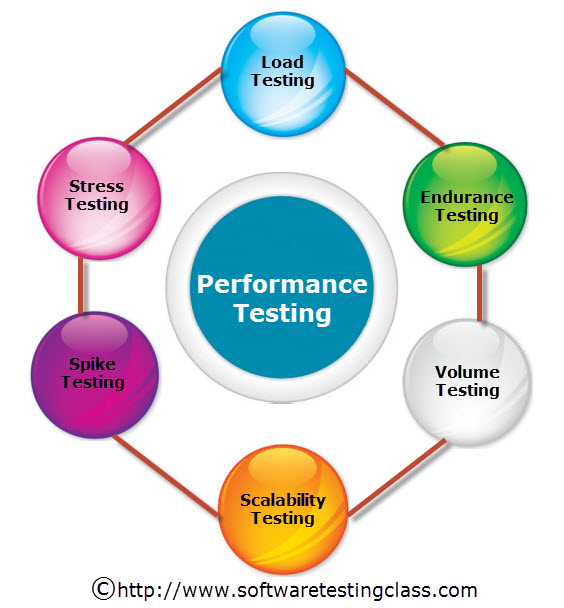
And there are of course other kinds of testing we may want to support that take much longer to run: performance testing, security testing, durability testing, reliability testing, and the list goes on. These things need to be done before the organization can release the software to production but there’s no dedicated place to go get them done. There’s no way to discover potential problems when they’re easy to fix. It’s hard to fail quickly.
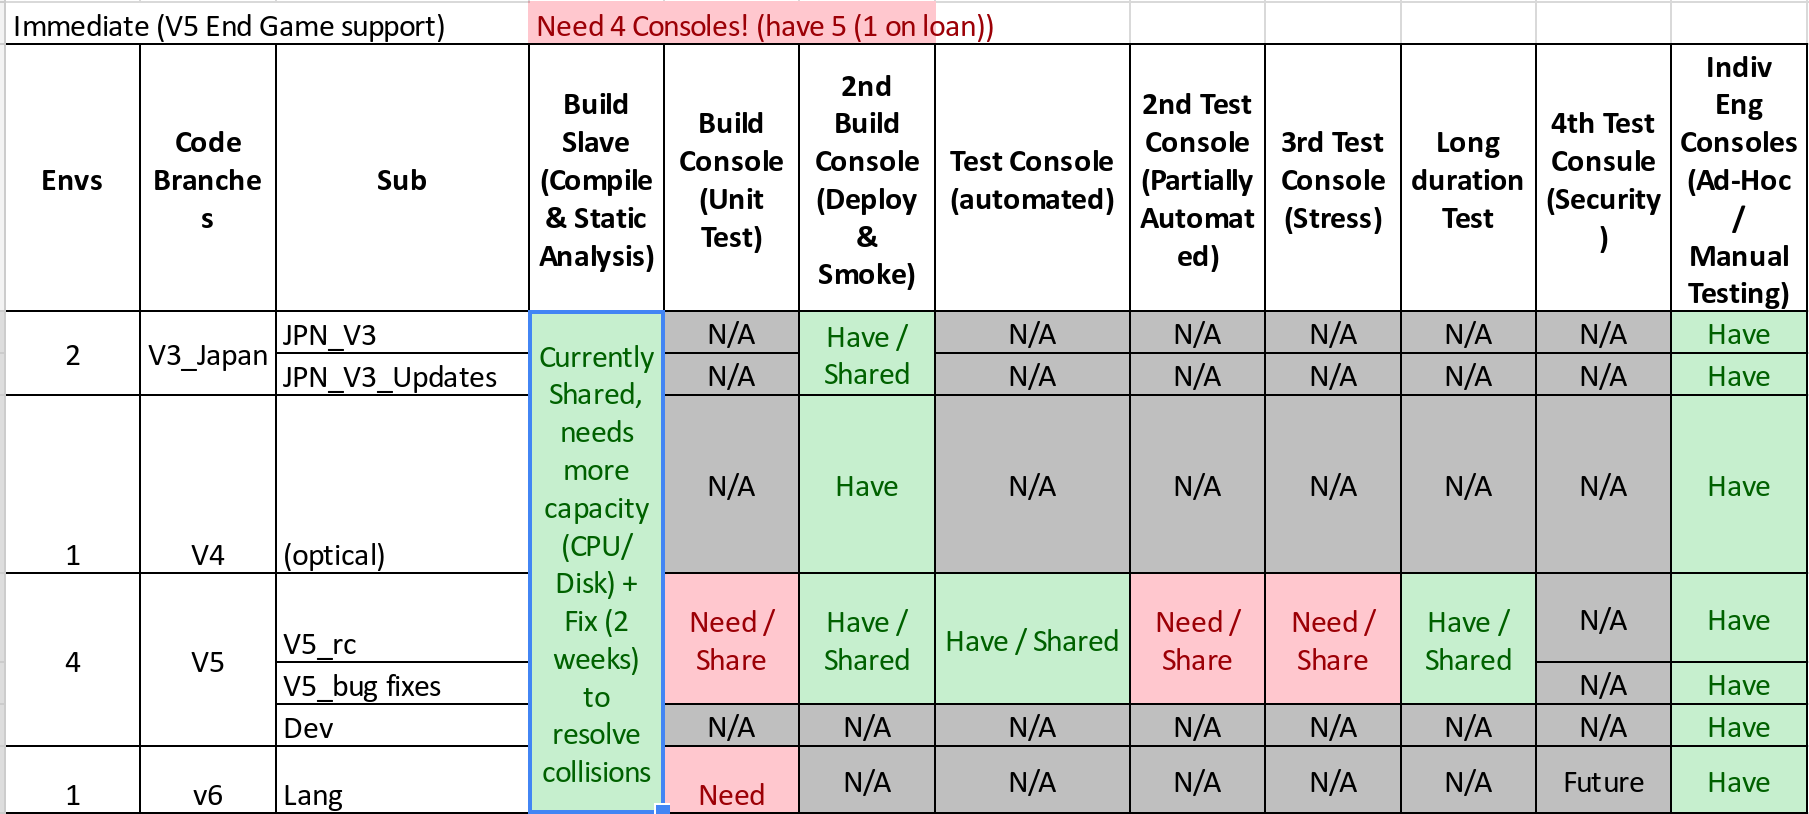
But… this is idealistic. In reality, the team is supporting multiple different streams of work. And these workstreams are decidedly independent. For one thing, they, like many other teams, have multiple older releases that need support. These older releases work with different versions of the firmware, and in one case, with different hardware requirements. But work doesn’t happen in these branches often. So maybe we can save a little here by not trying to keep a whole pipeline available for these maintenance activities.
That’s not all though. There’s also the work that goes on to build the various features the team is committing to in each sprint. By and large, these features, aggregated into epics, do not have regulatory approval. They cannot be merged back to development, and so they can’t rely on the development infrastructure. Imagine having to wait to get a build for your branch done because a branch belonging to another team member has a build in progress. When there are 3-4 branches like this, it doesn’t take long to convince the team that each branch needs it’s own infrastructure. Again, this is a basic productivity and cycle time issue. Work can’t get done while the developers or testers are waiting on a build/deploy/test cycle to finish.
Let’s say the team decides 3 independent branches + development is what they’d like to be able to support. If the team commits to more work than that, some of those branches will just have to share. No big deal. That brings us up to 14 targets just to support the day to day work of the development team. We haven’t even talked about the deeper kinds of testing the Verification and Validation team wants to do before a release and what the Test Automation team will want to have running regularly.
Fail Early, Fail Often
For one thing, this is a medical device, it needs to work without issues for an extended period of time (say, 1-2 weeks) at a normal level of use (say, buttons pressed every n number of seconds). Functionality can’t degrade and the box can’t crash. This is called durability testing and it took maybe a day for one of the new automated testers to put a script together to do this. Shouldn’t we be running this test on some regular schedule against whatever latest stable build is available in a branch? I’d say just development, but these branches last for an entire release cycle. If a new feature is causing durability problems, the team needs to know and needs to be able to do something about it. So that’s an additional box for each branch.
Then there’s more intense testing, like performance testing. In our previous test, we were looking for reliability over a long period of time. Now we want to measure stability and functionality under different kinds of application-specific loads. Maybe we don’t need to do this for as long, but we want to really stress the hell out of the system. We need a place to run these tests. Let’s say the total time, for all different kinds of loads, adds up to about the same length of time as the durability test. Then we only need one additional box for each branch.
Oh, and there’s more periodic testing, maybe once per sprint, in the form of tests that are mostly automated, but at particular junctures need some manipulation of the hardware. For example, one module may need to be disconnected and swapped for another so the test can be repeated. It turns out there are a of a lot of tests like this when developing automated tests for a hardware device. These tests need to be performed to validate the software the development team has produced for a sprint. Stories can’t be closed until these tests are run. Some of the testing load can fall on the testers individual test units, but that means the automated testers can’t continue writing tests while these tests are running. It would be far better if they can lean on the delivery pipeline to run their tests, so we’ll need some boxes set aside for partially automated tests as well. Let’s again say one per branch will suffice for now, and reallocate depending on what’s in use/not in use when the need arises through the year we’re planning for.
What about security testing? In our case, business thinks it’s not that important. Everyone using the boxes in the real world is a trained medical professional so the assumption is that there are no bad actors with physical access to the boxes, and we can just tell the staff not to ever put these boxes on the network. That’s a business risk. We’ll want to cover this eventually, but we don’t need it right now. (N.B. this is not a recommendation.)
We’ll still need a few more devices. For one thing, the DevOps team needs a box they can point at to test various things, like changes to the deployment process, and they shouldn’t be directly testing those on the main build boxes, possibly interrupting the production delivery pipeline. The test automation team will need a place to test changes to the underlying test framework that the automated tests are being developed on. Framework tests shouldn’t be incorporated into the main application build without passing some kind of vetting, so that’s another allocated unit.
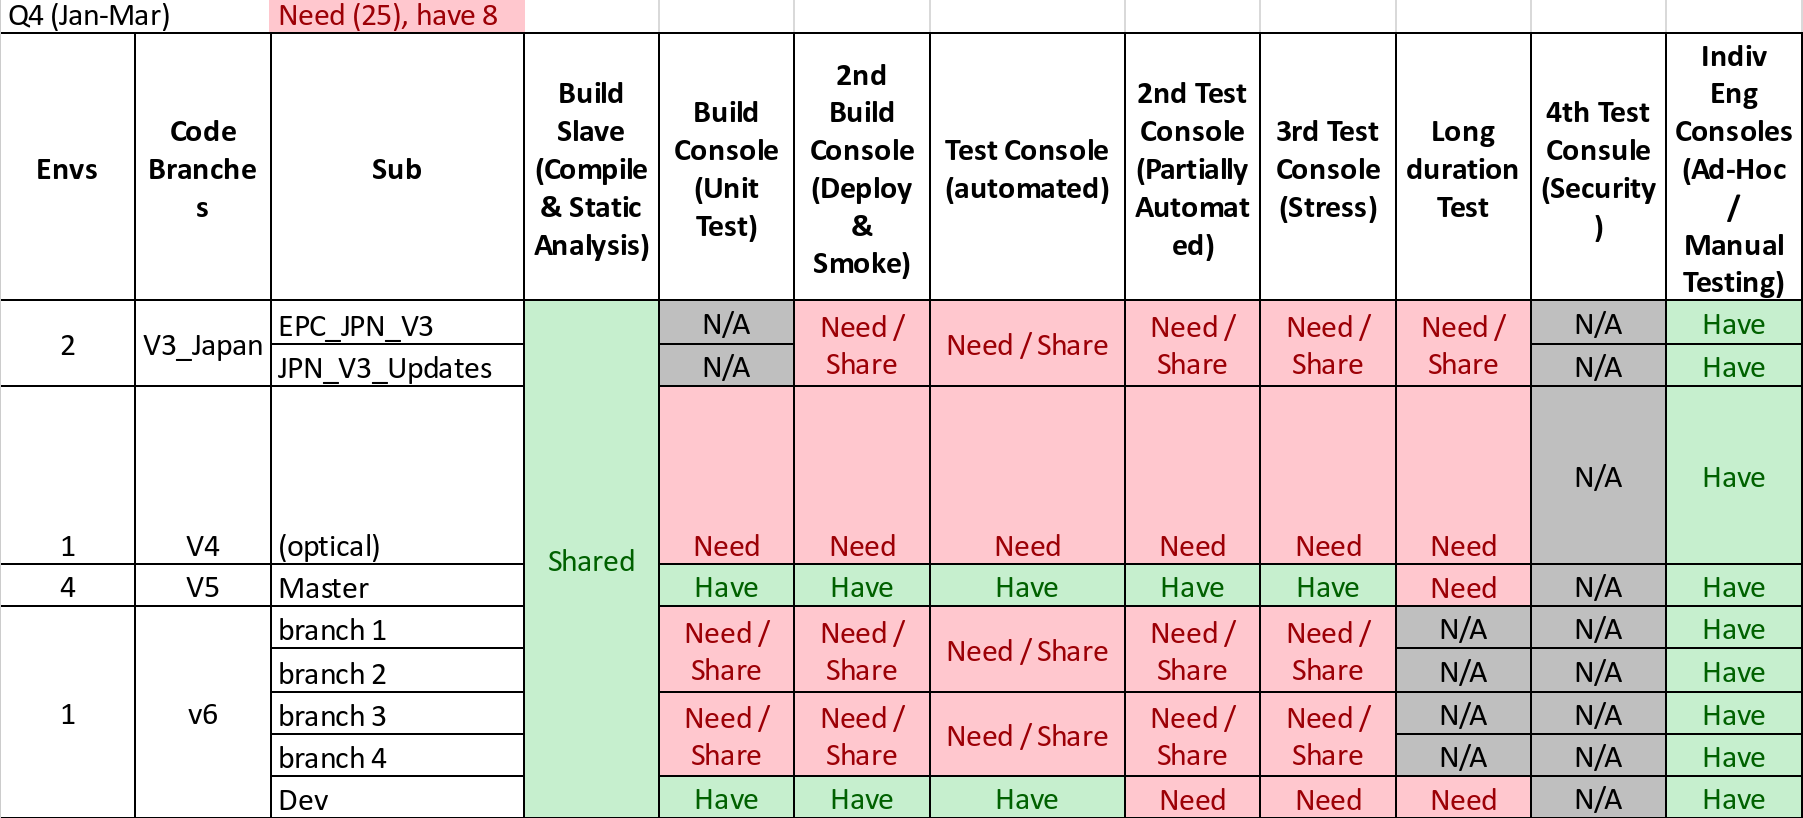
That’s 28 units for just one scrum team, a gigantic internal purchase order. Sure, these weren’t all immediately needed, but when we did this analysis at the end of last year, we were pretty sure we’d need them all by the end of Q1, just based on what the software team wanted to be able to support. 28 boxes is a pretty sizable hardware farm. Yes, we could reduce the number necessary by doing some intelligent things. None of the ideas required to reduce hardware requirements were even planned, let alone developed or tested. Using an expensive resource like a developer to manually allocate these resources winds up being less cost effective than just putting in the purchase order. Put in those terms to the business, it was quickly decided to go ahead and do it. The team needed to grow rapidly, and even if we have gotten by with less then, we would likely have started to fall short long before the year was out.
Managing Locks
Resources will always be limited though. The business may have come back and said that we could only have 20 units. Or 15. What could we have done to get by without hurting the team’s productivity?
More to the point, there was an implication previously about stuff running concurrently. It’s definitely not safe to try and run the automated tests while a new build is being pushed to the target! Nor is it safe to deploy a new build while the last build is still being unpacked!
So first things first, we needed some kind of locking strategy. We tried a few things that didn’t work (doing the locking on the Jenkins side was just a no-go), and eventually settled on an old trick that’s used in the Linux world – drop a lock file to let the resource-requester know there’s work already happening. Putting a lock file into persistent storage is easy and removing the lock file is even easier. There’s no need to fail if the lock isn’t present, just rm -f it to make sure it’s definitely gone.
Putting these things together is more interesting. We were scripting our deployment jobs with Jenkins Pipeline, so a little bit of groovy gets us a nice little function that acquires a lock, runs a block of code, and then releases the lock even in the face of errors executing the block.
def locking(box, block) {
    acquireLock(box)
    try {
        block()
    } finally {
        clearLock(box)
    }
}
Assuming acquireLock is a blocking function and clearLock just ensures the lock is cleaned up whether it was successfully acquired or not, it’s a nice little piece of syntax in actual use:
    downloadTests(latest)
    locking(1.2.3.4) {
        deploy(1.2.3.4, myBuild)
        runTests(1.2.3.4, myBuild, testTags)
    }
As long as all environment accesses are wrapped in locking() blocks, and clearLock cannot fail, we have a runtime guarantee that we won’t accidentally brick a console.
Full Blown Resource Management
Still, there’s still more we could do. We can be smarter about how we allocate the available targets, and so reduce the number we need in practice. We basically need a pool of boxes.
If you’re familiar with the thread pool concept from the concurrency world, the idea is exactly the same, swapping operating system threads for physical hardware units. Each target runs a service to phone home every minute or so and maintain a queue of targets on the central resource manager. Even better yet, we can keep separate queues of boxes depending on the configuration of the boxes, for incompatible configurations. With that done, we can put up a REST API in front of the manager that let’s clients (particular runs of any number of Jenkins jobs, for instance) phone in to request a box, with a database behind it so it doesn’t lose its state and so we can track statistics about capacity, utilization, normal length of time a box is in use, etc.. Now we have a resource manager that’s convenient to use and intelligently tracks our ever-growing collection of hardware and ensures its in use.
We can even do away with the lock files on the consoles. In fact, there’s a race condition, so we might want to. If there’s only one console available, a job requests it, and before the job acquires the lock, the console phones home and announces itself as available. Then another job requests a console. The first job has taken the lock, so this one is stuck waiting for the first job to finish. As far as race conditions go, it’s not a bad one, but it does mean that a job sometimes has to wait longer than necessary. One way to solve it is to use the non-blocking lock and ask for a new console instead. The other is to do away with the locks and have the manager turn off the “report home” service on the console, then return its address to the requesting client. When the client finishes, instead of releasing the lock, it sends a release request to the manager with the address so the manager can turn reporting back on. In fact, we can use the same try/finally construct we used before to make sure this works properly. Pick your favorite and try it at home.
One of the nice things about this kind of manager is the ability to easily generalize it to handle entirely different kinds of resources. So there’s no doubt this development effort would pay dividends in the future. Moreover, there’s opportunity to build out the interface further. There are plenty of Javascript libraries that provide tty emulators in the web browser, and it wouldn’t be all that hard to have the front-end serve one up that drops you onto a console already logged onto a target. And the phone-home service could become a health check, reporting the status of the operating system and software. “I’m in use but all my services are running” and “I was in use but I crashed because X service went down and here’s the appropriate log”. That would be an incredibly helpful diagnostic resource for the team.
Unfortunately, we never had time to build it on this project, but maybe these thoughts and suggestions can help you build it for your organization.
That’s everything, folks. Leave a comment if you have any questions or feedback, I’d love to hear from any of you. In particular, I’d really like to hear if there’s anything I didn’t delve into that you’re curious about. And thanks so much for reading this far!