
Sonar is a tool to analyze and visualize code quality in Java projects. It isn’t a static code analysis tool itself, rather it uses a number of open source tools to analyze the code, then Sonar gathers the metrics. Its strength is in providing a dashboard, trend reports, and drill downs to help visualize the state of a software project’s code quality. Sonar runs as a server (or a service on Windows), or it can be deployed within an app server. However, if it is deployed within an app server, Sonar must be repackaged as a WAR file and redeployed any time the configuration is changed or a new plug-in is added. Sonar uses a database to store historical metrics. It comes with an internal database (Apache Derby) but it is recommended that an external, enterprise database is used, such as MySQL, Oracle, or PostgreSQL. Microsoft SQL Server will work as well.
Installation
Installation of Sonar is very straightforward. First, create a database for sonar to store the collected metrics in.
    mysql> CREATE DATABASE sonar CHARACTER SET utf8 COLLATE utf8_general_ci;
    mysql> grant all privileges on sonar.\* to 'sonar'@'localhost' identified by 'somepassword';
    mysql> flush privileges;
    mysql> \q
Download and unpack the distribution. Edit the conf/sonar.properties to disable the internal Derby database and connect to the external database you created.
    #sonar.jdbc.url:                            jdbc:derby://localhost:1527/sonar;create=true
    #sonar.jdbc.driverClassName:                org.apache.derby.jdbc.ClientDriver
    #sonar.jdbc.defaultTransactionIsolation:    1
    #sonar.jdbc.validationQuery:                values(1)
    sonar.jdbc.url:                            jdbc:mysql://localhost:3306/sonar?useUnicode=true&characterEncoding=utf8
    sonar.jdbc.driverClassName:                com.mysql.jdbc.Driver
    sonar.jdbc.validationQuery:                select 1
    # generic settings
    sonar.jdbc.username:                       sonar
    sonar.jdbc.password:                       somepassword
Finally, start the Sonar server. On Linux:
bin/linux-x86-32/sonar.sh
Or on Windows:
    bin/windows-x86-32/InstallNTService.bat
    bin/windows-x86-32/StartNTService.bat
The Sonar Web server will be available at localhost:9000, ready to display any data that gets collected.
Using Maven
Sonar collects data using a Maven plug-in, so what little configuration is required is done through the pom.xml file. In general, you’ll just need to point the Maven plug-in at the database.
    <?xml version="1.0" encoding="UTF-8"?>
    <project xmlns="http://maven.apache.org/POM/4.0.0" xmlns:xsi="http://www.w3.org/2001/XMLSchema-instance"
        xsi:schemaLocation="http://maven.apache.org/POM/4.0.0 http://maven.apache.org/maven-v4_0_0.xsd">
      <modelVersion>4.0.0</modelVersion>
      <groupId>com.coveros</groupId>
      <artifactId>sample-maven</artifactId>
      <packaging>jar</packaging>
      <version>0.0.1-SNAPSHOT</version>
      <name>SampleMavenApp</name>
      <url>http://www.coveros.com</url>

      <build>
        <finalName>coveros-sample</finalName>
        <plugins>
          <plugin>
            <groupId>org.apache.maven.plugins</groupId>
            <artifactId>maven-compiler-plugin</artifactId>
            <configuration>
              <source>1.6</source>
              <target>1.6</target>
            </configuration>
          </plugin>
        </plugins>
      </build>

      <properties>
        <project.build.sourceEncoding>UTF-8</project.build.sourceEncoding>
        <sonar.jdbc.url>jdbc:mysql://localhost:3306/sonar?useUnicode=true&characterEncoding=utf8</sonar.jdbc.url>
        <sonar.jdbc.driver>com.mysql.jdbc.Driver</sonar.jdbc.driver>
        <sonar.jdbc.username>sonar</sonar.jdbc.username>
        <sonar.jdbc.password>somepassword</sonar.jdbc.password>
      </properties>
    </project>
Use Maven to run an installation without running unit tests, and then run the sonar goal. Sonar will run unit tests and static analysis tools itself, and will push the collected metrics to the Sonar server.
    mvn clean install -Dtest=false -DfailIfNoTests=false
    mvn sonar:sonar
Then, use your browser to visit localhost:9000. It may take a minute or so for Sonar to process the data, but soon after you’ll be able to see a dashboard with a slew of code and code quality metrics.
Not using Maven
Although Sonar uses Maven, your project does not have to. It requires a little bit more work, but the “Sonar Light” mode (v1.6, later versions dropped this functionality in favor of a specific build step that relies upon Sonar Runner) can be used to run your code analyses in Ant, and then just use Maven to collect the data for Sonar. You can also use Hudson’s Sonar plugin to collect code metrics directly from the Hudson continuous integration engine. It is recommended that Sonar only be used on nightly builds since only one set of metrics per day will be kept.
Looking at the Data
On the first page, Sonar shows a list of projects that are using sonar, along with metrics for rules compliance, code coverage, and when data was less collected. By clicking on the project name you can see a much more detailed dashboard.
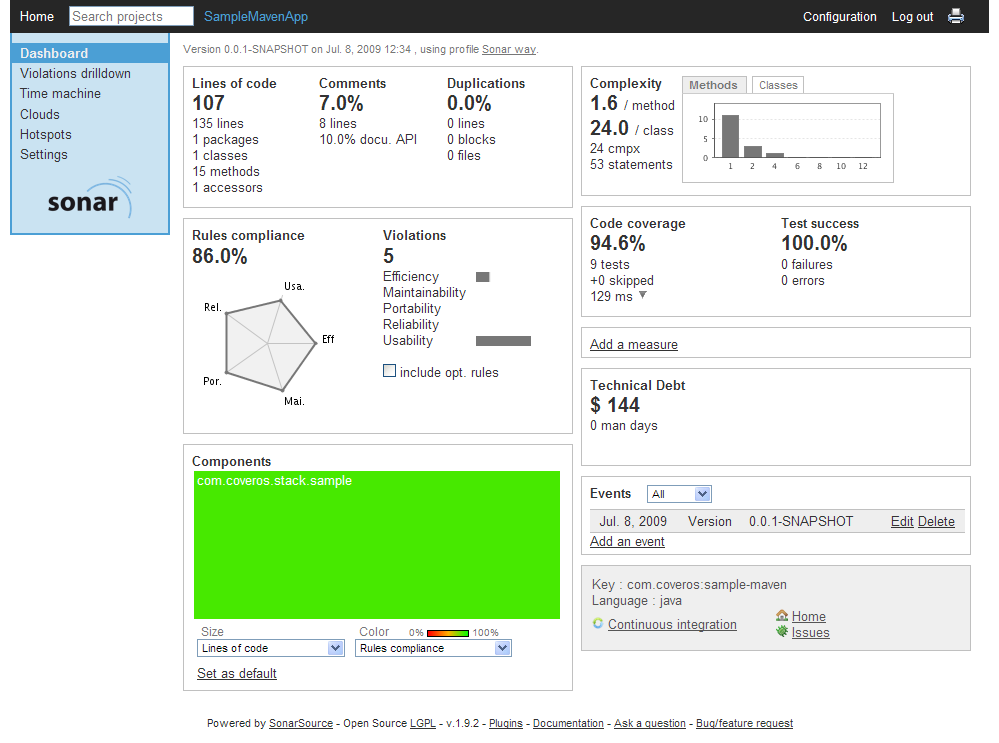
Lines of code and code size metrics are displayed along with a metric for commented code as well as duplicated code. Code complexity at method and class levels are shown with code coverage and test results. PMD and Checkstyle rules compliance is broken down into five categories and displayed as well. Just about every value can be clicked on to drill down for more detail. The Time Machine allows you to view almost any metric over time. Events are created whenever the version (specified in the pom.xml) for the project is changed, or by adding an event manually from the dashboard. Each of these events is highlighted in the Time Machine. The Clouds and Hotspots features can be used to quickly identify “low hanging fruit” candidates for refactoring and improvement. Like other pages, drill downs are available throughout.
Technical Debt
One very interesting metric that can be collected is technical debt. In essence, technical debt rolls up the code quality metrics into a single estimate in time and money to bring all of the metrics to their maximum value (no violations, no duplicated code, 100% code coverage, etc.). It provides an “executive summary”-type value that will allow projects to be compared on an overall level of quality. Combined with the Time Machine feature, a trend of overall code quality over time can be seen. A chart shows the relative magnitude of the pieces contributing to the technical debt. The values (time and money) used in creating the estimate can be configured from the Sonar web interface. (Log in, then Configuration > Settings > Technical Debt.) The Technical Debt Plug-in is easy to install. Download the plug-in jar file, place it in the extensions/plug-insdirectory, and restart Sonar. The next time that metrics data are collected for Sonar, technical debt metrics will be calculated and displayed.
More Examples
A live instance of Sonar running against a few dozen open source projects can be viewed at http://nemo.sonar.codehaus.org/.