I’ve been working in the mobile space plenty recently, and exploring a whole host of tools. One of the great tools I recently stumbled across was Blazemeter. Among other things, Blazemeter lets you playback a recorded script of web traffic, and simulate user load, similar to JMeter. Blazemeter, however, can mimic all sorts of different networks, and has some pretty neat plugins. This post will cover how to record some traffic from your mobile device or emulator, and then playback that information in Blazemeter, simulating a true cell phone network.
The first thing we want to do is download and run JMeter. Once downloaded, simply unzip the package, and execute the file appropriate for your operating system. I am using v2.9 for my instructions and screenshots, newer versions do have some of the features located in different areas. Once we have JMeter running, we want to set it up as a proxy server to capture all of our internet traffic. To do this, simply right click on the workspace of the new project, select Add -> None-Test Element -> HTTP Proxy Server.
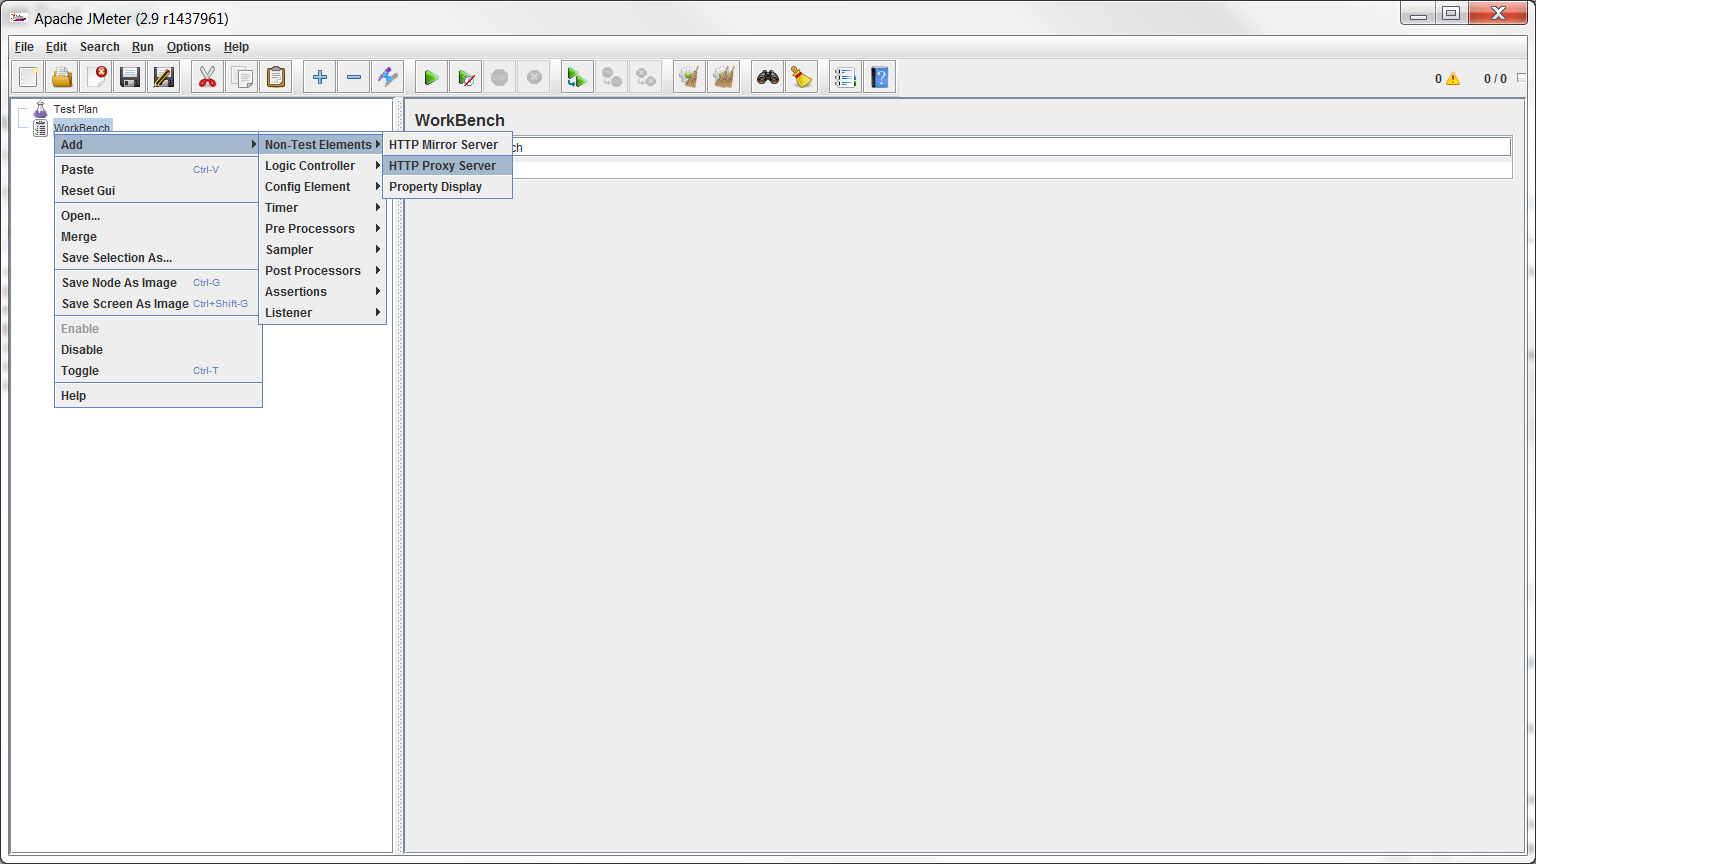
We then want to setup the proxy to a port that we have open on our machine. I chose 5013, simply because I like the number, and I know nothing else is using this port. I used netstat to determine that port was free.
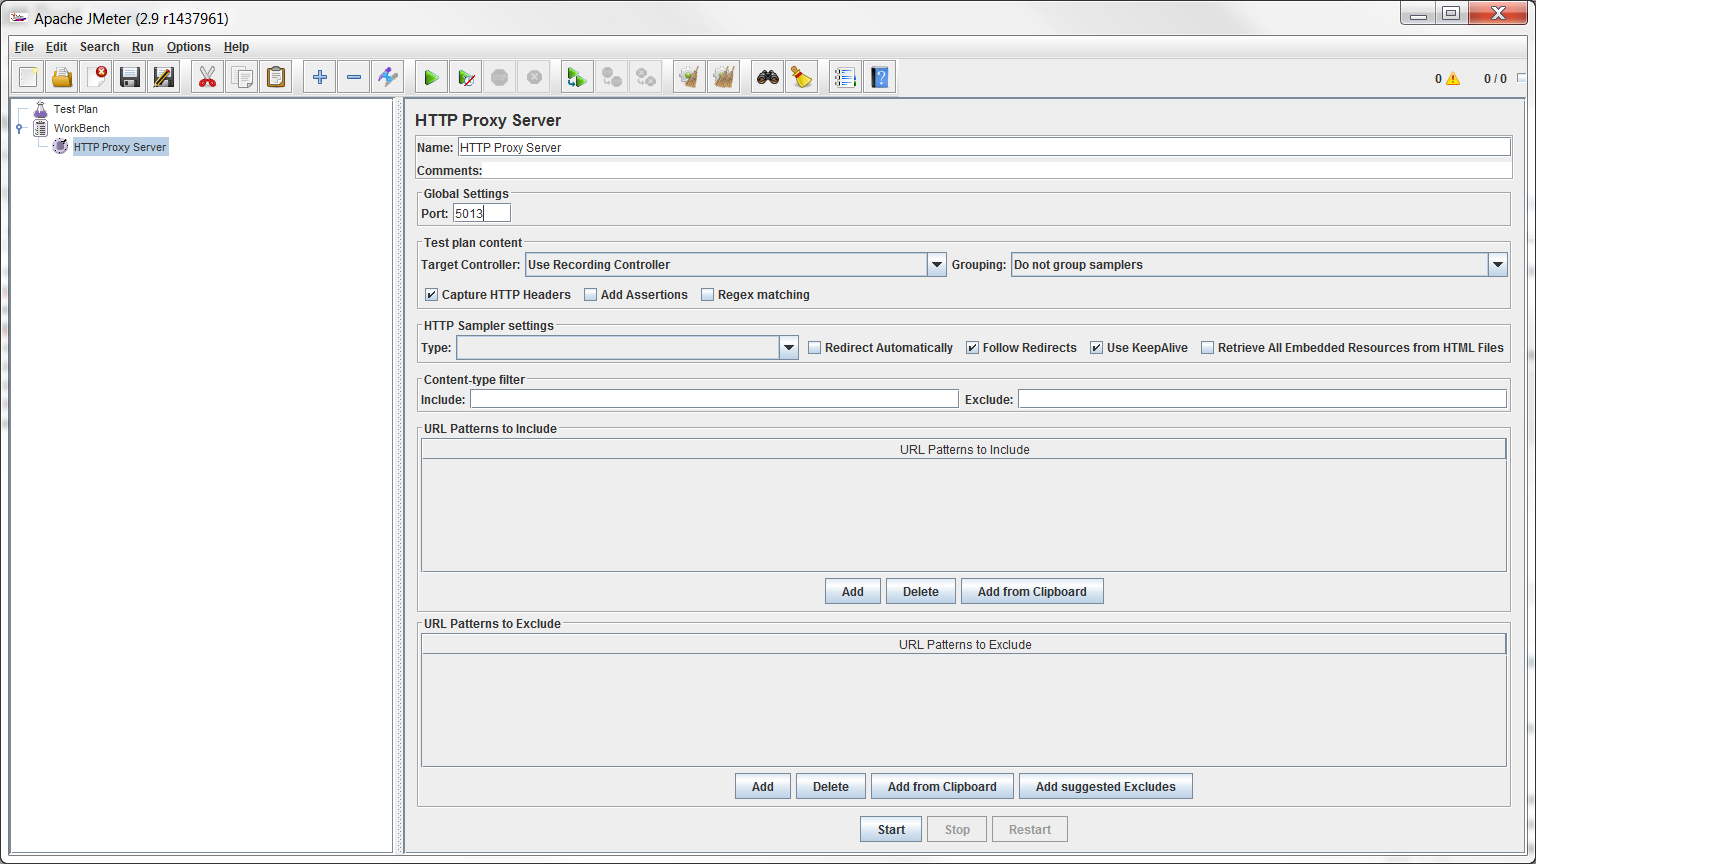
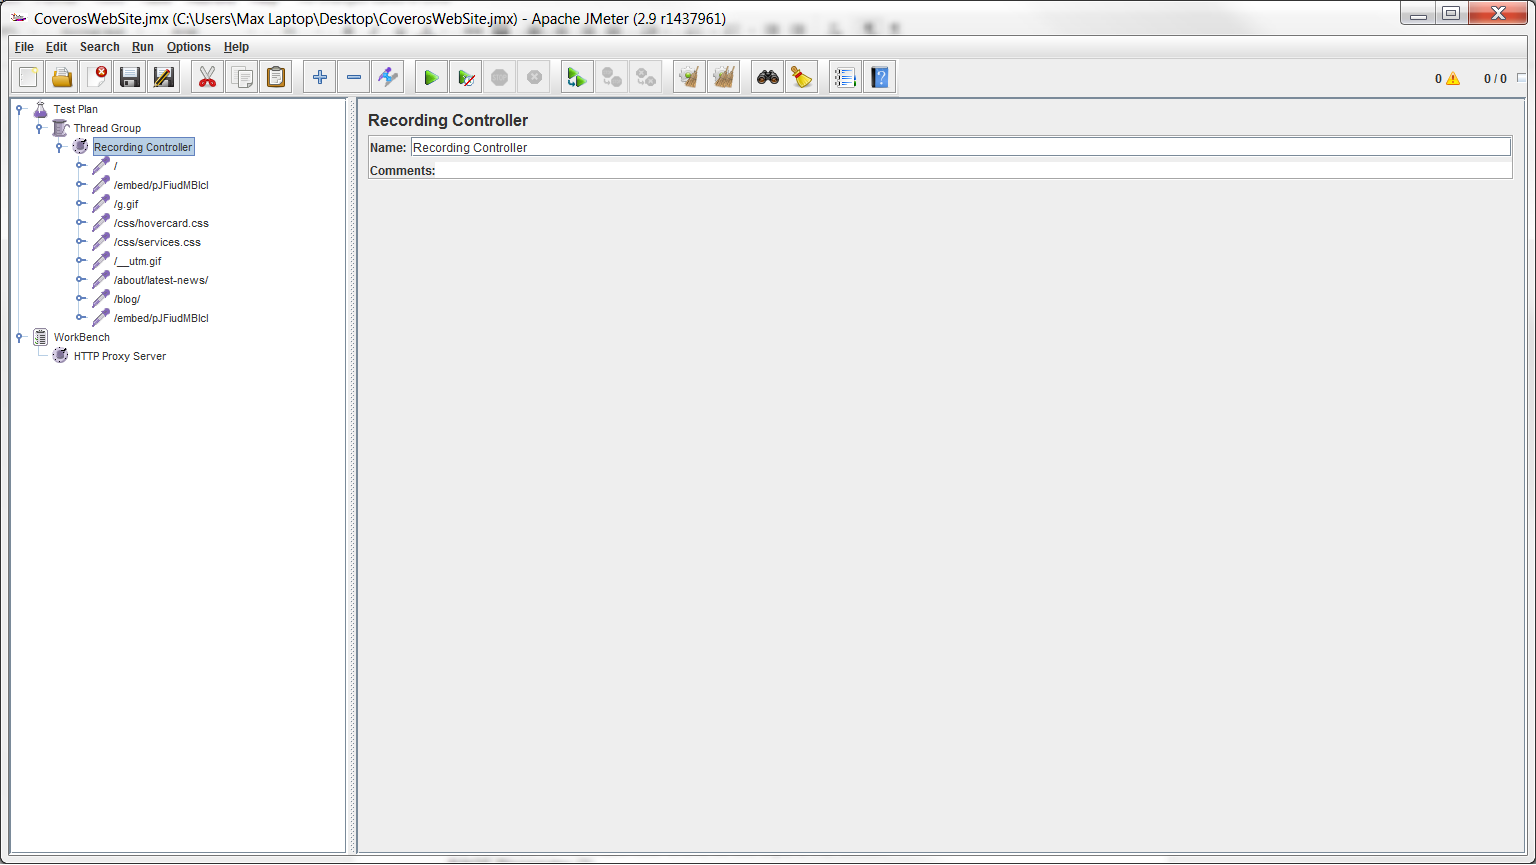
Click start at the bottom of the screen. Now to ensure we can save our test plan data, let’s add the appropriate recorders. Right click on Test Plan, select Add -> Threads (Users) -> Thread Group. Now right click on Thread Group, select Add -> Logic Controller -> Recording Controller. Leave this selected controller selected, and that’s it for JMeter, we are all setup and ready to record. If we want to verify that we are indeed recording traffic. We can point our browser to localhost:5013, and although the browser will display errors, JMeter will show some traffic.
Make sure that we delete any non-wanted records recorded this way.
Next we want to configure our mobile device. This can be done very similarly on an emulator, or physical device. First thing we need to do is determine the IP of the machine running JMeter. We need to be able to point our device at that machine. To do this, enter the command ipconfig (or ifconfig on Mac/Unix) at a command line. This will give you your internal network address. As long as your device will be connected to the same network, we can use this address, i.e. emulator, or connected via wifi to the same network. If you are connecting your physical device over it’s cellular network, you will need to determine the outward facing IP of your machine. To do this, go to a site such as www.whatismyip.com. You will also need to ensure that your machine at the port you specified is accessible. This may mean setting up port forwarding if you are behind a router or firewall.
Once you have determined how to connect to your machine via the JMeter Proxy, we need to configure the device.
- Apple
- Click Settings
- Click on Wifi
- Select your Wifi Connection
- Scroll to the bottom of the screen and select Manual
- Enter the IP for Server
- Enter the Port for Port
- Android – Physical
- Goto Apps
- Click Settings
- Click on Wifi
- Click and Hold on your Wifi Connection
- Select Modify Network
- Check Show advanced options
- Choose Manual for Proxy Settings
- Enter the IP for Proxy Hostname
- Enter the Port for Proxy Port
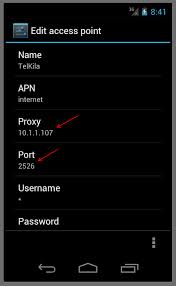
- Android – Emulator (note must be on 4.4.2 or greater)
- Goto Apps
- Click Settings
- Click on More
- Click on Mobile Networks
- Click on Access Point Names
- Click on an Access Point
- Enter the IP for Proxy Hostname
- Enter the Port for Proxy Port
Finally we are all ready to record our network traffic. On your mobile device, open your application (either mobile web or native), and start using it. Check back in with your JMeter session at least once early on in your testing to ensure it is properly capturing all of the data you are sending. Make sure you give it plenty of use, I’d suggest at least 10 minutes of traffic. If you want, feel free to jump back into JMeter to copy/paste some of your traffic, just to generate more. Once you have enough data, click stop in JMeter, and save your recording as a jmx file.
IMAGE JMeter Traffic
Now that we have our recording, we can execute this on Blazemeter. We could use this recording directly within JMeter, and accomplish many of the same tasks, so take note of some of the unique features that Blazemeter offers, as they are specific to mobile devices.
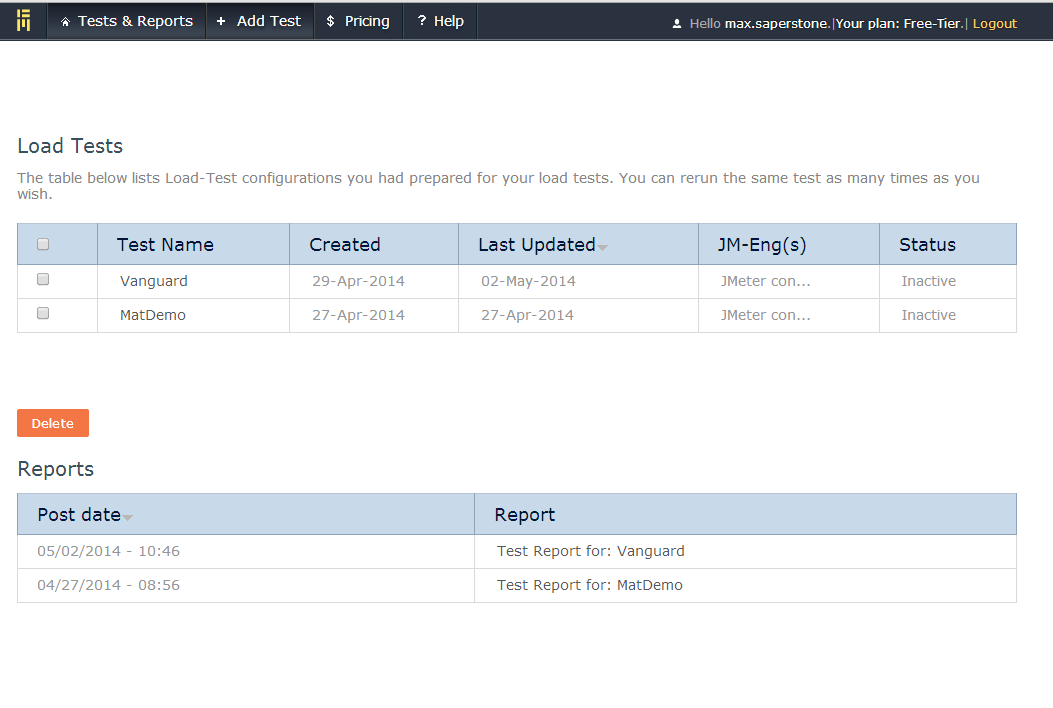
Login to Blazemeter, or sign up for a free account. At the top of the screen, click on Add Test, and then give your test a name. We want to run our JMeter test in the cloud, so the default setting should work fine for us. Upload your jmx file, and select the version of JMeter you used. Next we want to tweak our user settings. This is similar to what we can accomplish in JMeter, but the interface is a bit simpler, as well as allows for many more users (as we are testing in the cloud). Set the number of users desired and the rampup (how long between users start); the other setting defaults should be fine for us. Network emulation is one of the cool features that Blazemeter offers, so lets expand that section.
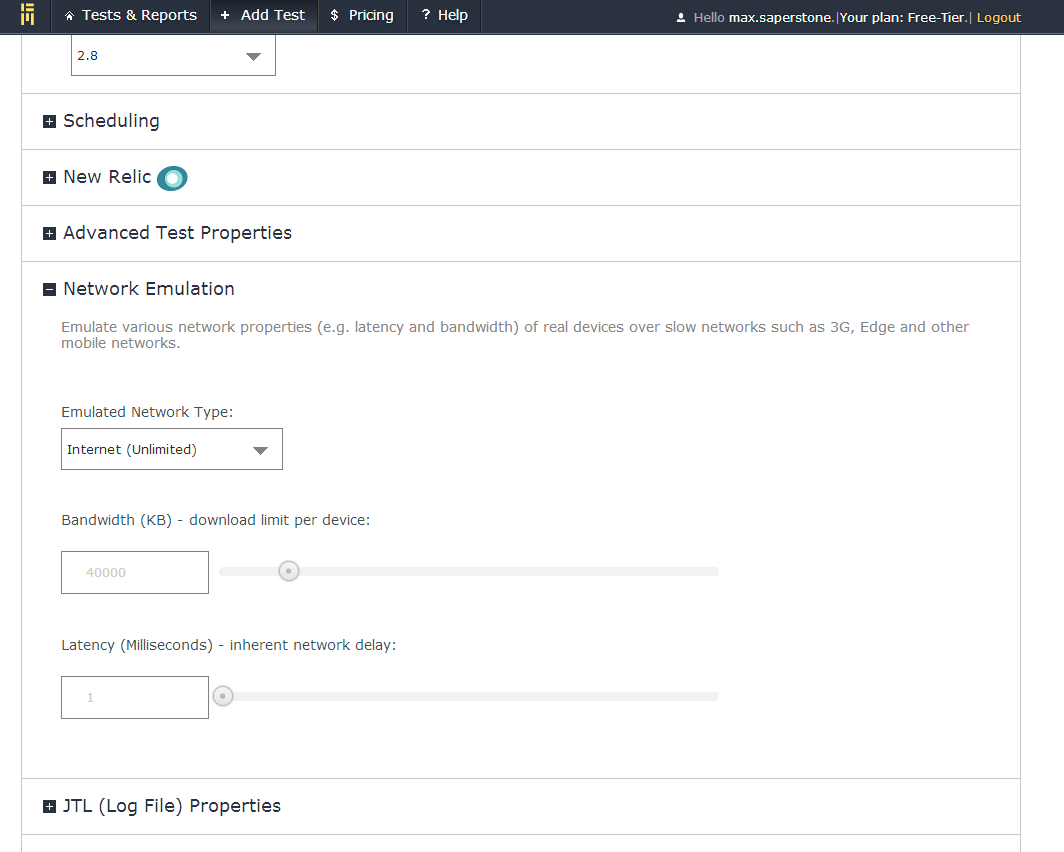
We can set our network, limit our bandwidth, and even create latency over the line. We can also setup Selenium monitoring, by specifying URLs, and have Blazemeter provide us with some automatically generated Selenium scripts.
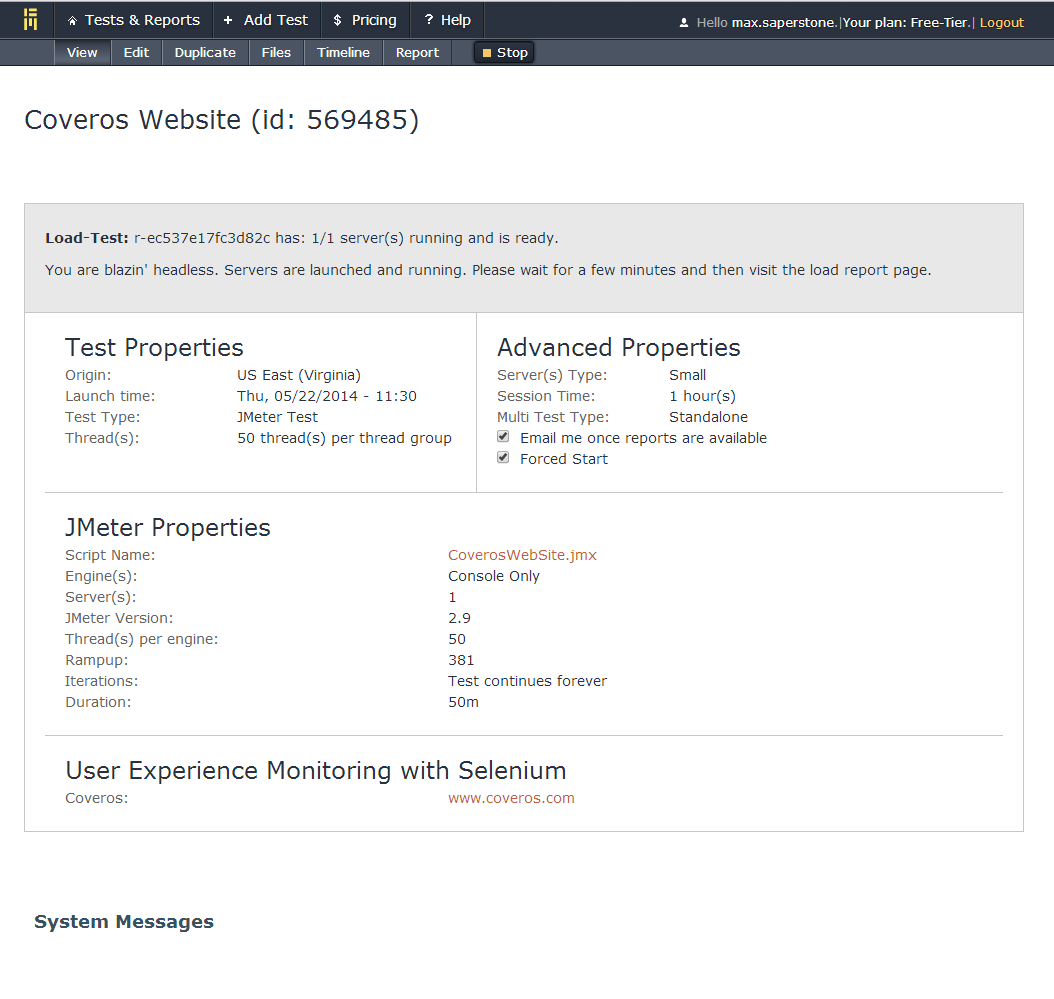
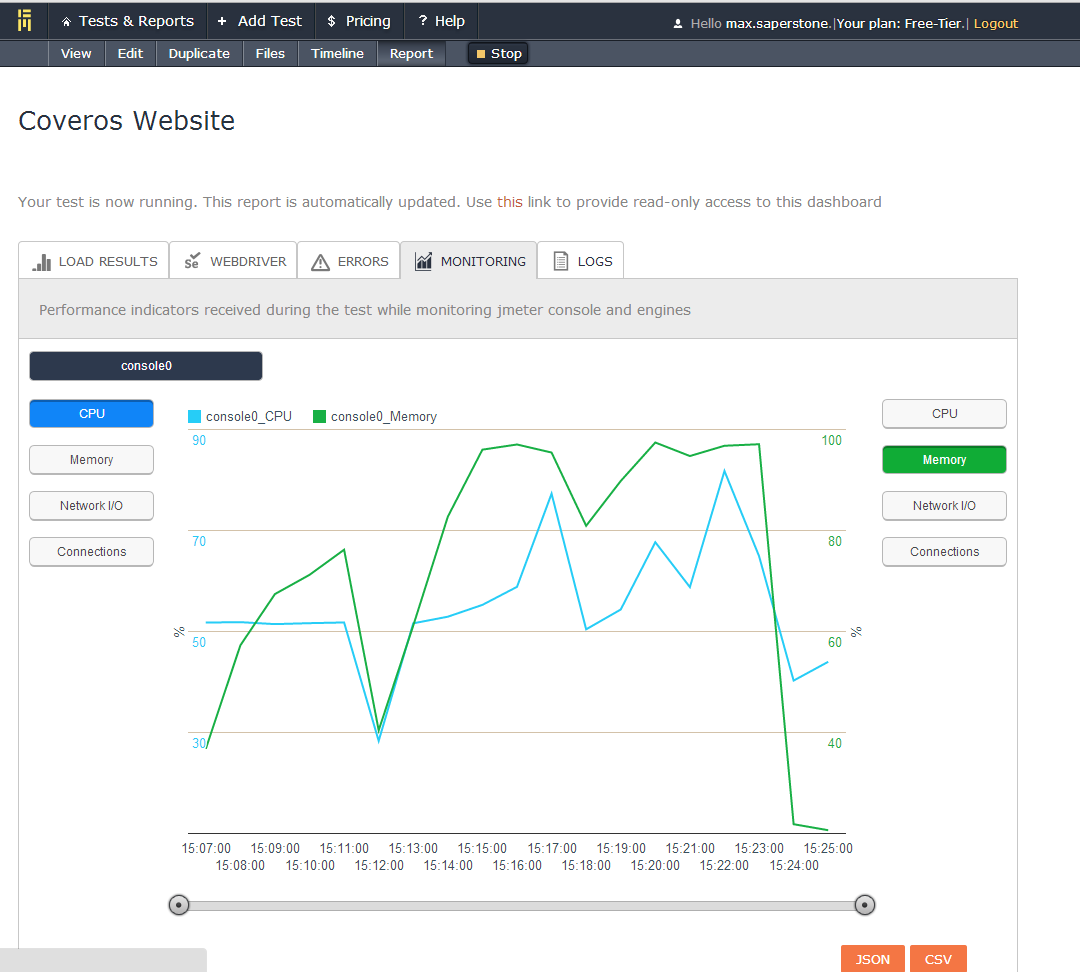
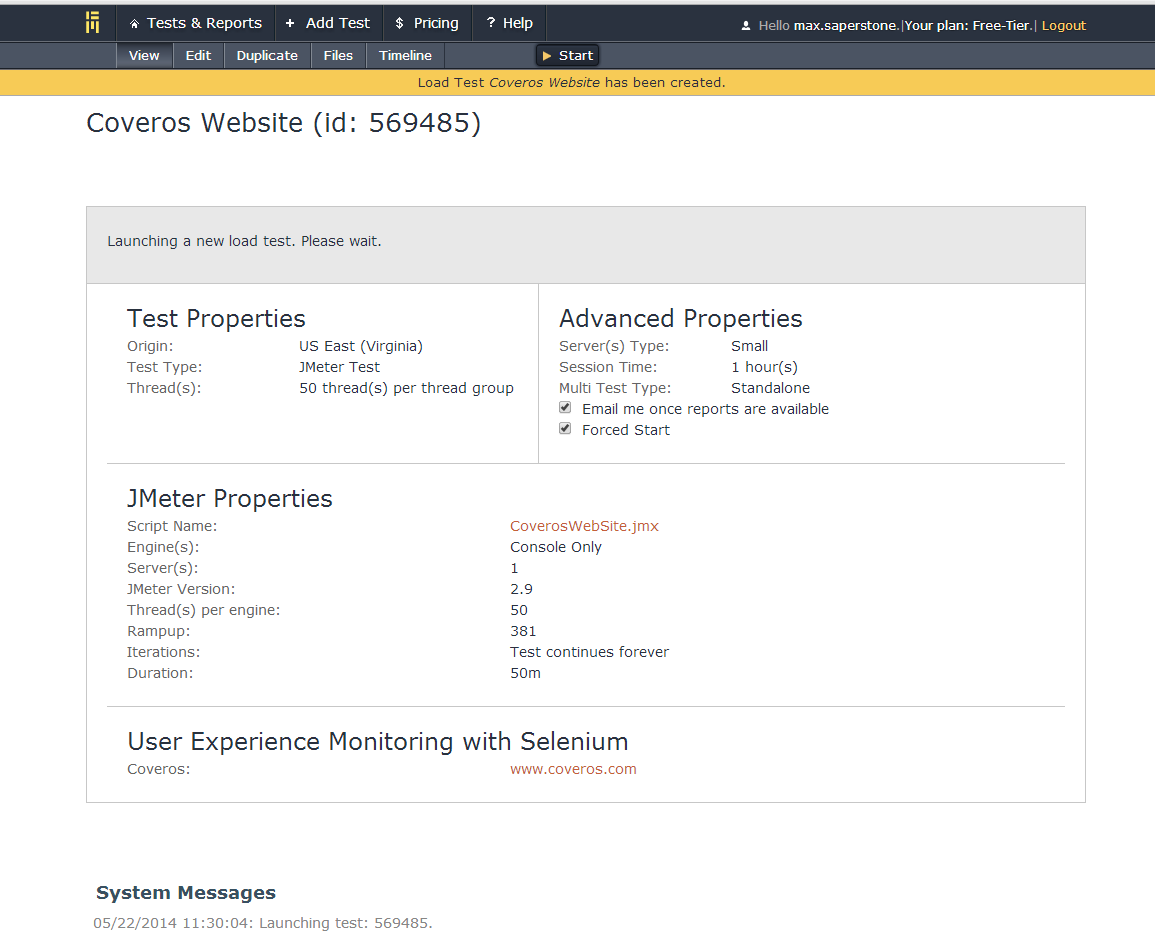
Once we are all done with our settings, click save, and then click start at the top of the next page. Confirm to launch the tests. Once the analysis starts, the page will automatically update, showing what current information is available. Clicking on the reports link at the top of the page after a few minutes will provide some additional details on the tests. These tests will take about an hour to run, so be patient.
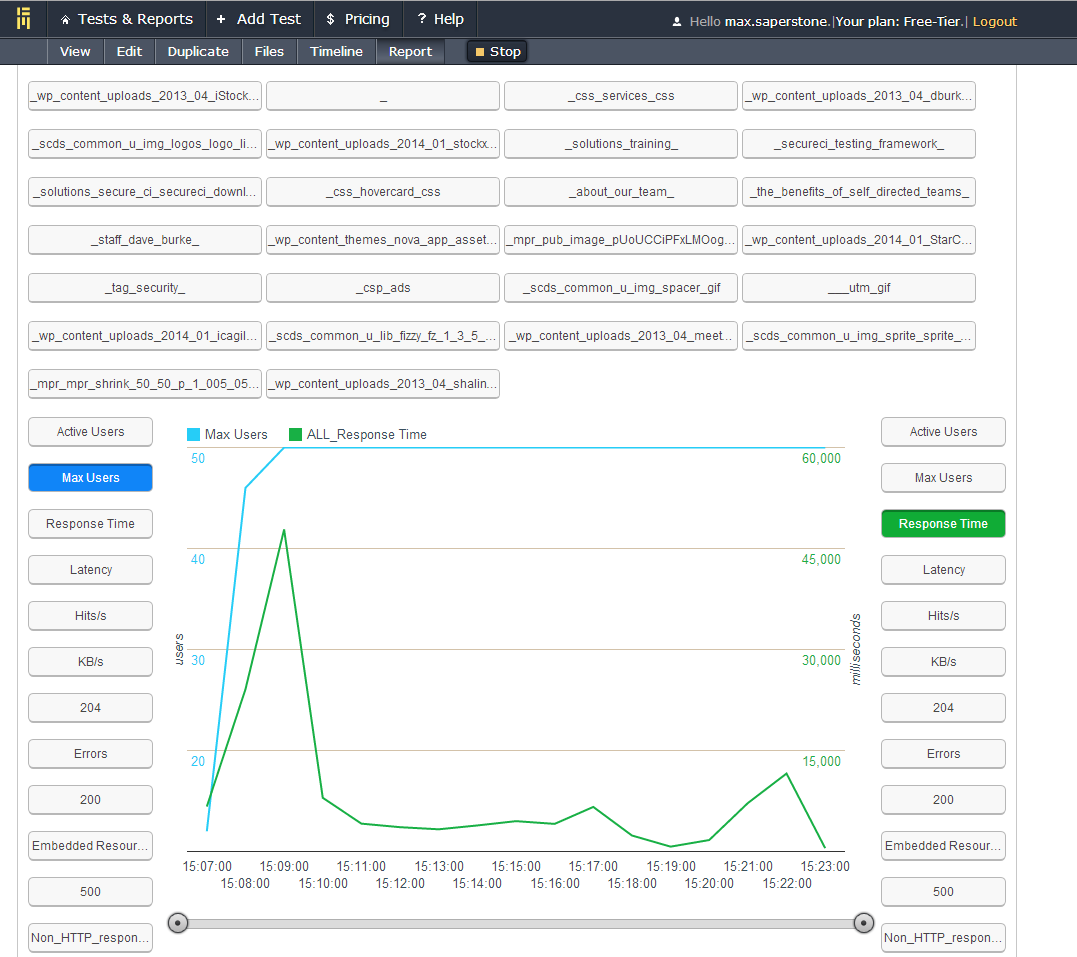
While results will populate as tests run, final results will give the best trending data. And that’s it! All of your mobile application network traffic was successfully run/analyzed from a network performance perspective. For a video of the full run, checkout my youtube video. Also be browse through our Channel to see some other great tools. Finally, if you are testing a mobile web application, make sure you checkout Blazemeter’s free Chrome extension, as it makes recording web traffic a breeze.