
The software development IDE, JetBrains PhpStorm, is a versatile tool to incorporate into a DevOps pipeline. One useful method of expanding upon its native features is to add the SonarQube plugin to provide source code analysis. Step-by-step documentation is scattered or insufficient, so I have compiled an explanation of the process, with accompanying screenshots.
This does require a running instance of SonarQube and works best with a local sonar-runner to perform testing prior to pushing any changes. In an ideal development lifecycle, code changes are made that are then validated locally before being committed and pushed to a testing environment. The local tests need to be run quickly so that many iterations can be performed.
To that end, SonarQube allows for both local testing of a single file, a group of files, or whole directories, while also analyzing the entire project after the changes are sent.
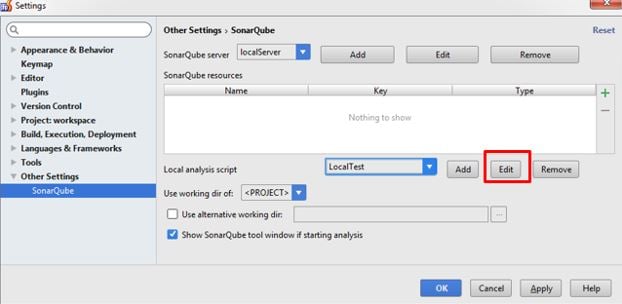
Once the plugin has been installed, configure it to target the SonarQube server through the File > Settings option. Alternatively, pressing “Ctrl+Alt+S” brings up the same menu. After the server is connected to PhpStorm and its project resources imported, the targets of the local scan are set.
As the SonarQube analysis on the server runs over the entire application, I prefer to make the scan test as little code as possible using the “Local analysis script”. This can be as specific as the current directory, or even a specific file. Reducing the size of the scan shortens the length of time needed to complete. As the entire application is scanned when sent to the SonarQube server, it is unnecessary to analyze more than the files that have been changed.
Pressing the Add or Edit button brings up the window below:
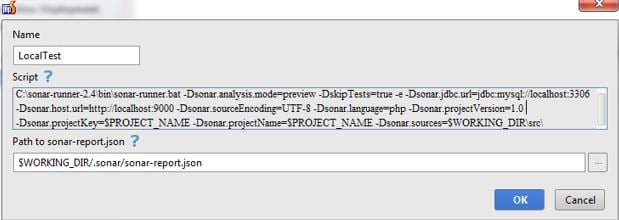
The sonar-runner script itself has 2 important properties that may change between scans. All of the other settings should remain constant.
Dsonar.analysis.mode=preview and Dsonar.sources=$WORKING_DIR\src\
The preview analysis mode (formerly dryRun mode) performs a full analysis, but doesn’t store the results in the database. Another useful mode is incremental, which only performs analysis on changed files.
The sonar sources property should be set to a specific sources directory, or a specific branch. For instance, if the workspace contains src\development\ and src\master\ the appropriate value can be used to limit the targets of a scan to only the current build.
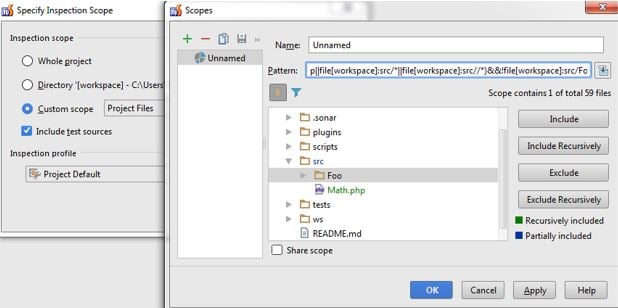
To further reduce or customize the list of files analyzed, use the Specify Inspection Scope after right-clicking on the project. From here files, directories, or a variation of include/exclude rules may be applied.
Following a local analysis, the results are compared to the chosen project on the SonarQube server. Setting a custom output highlights newly created issues.
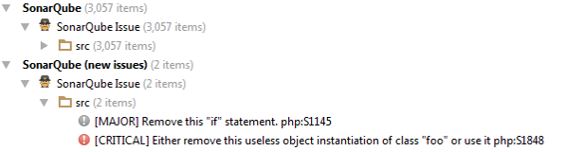
In this way, a developer is quickly informed whether the changes they are making will add to the existing technical debt by creating new issues. By performing the local analysis, the developer can be aware of a problem, and fix it before ever committing their code.