Introduction – When the number of states becomes the problem
State diagrams have long been a useful tool for testers to understand and validate system behavior. By visualizing a complex system state model as a set of states and transitions triggered by events, testers can reason about expected outcomes, identify missing cases, and design more systematic test coverage. When used well, state diagrams turn implicit behavior into something visible, discussable, and testable.
However, as systems grow in complexity, traditional flat state diagrams begin to break down. Features interact, modes overlap, and edge cases multiply. What starts as a helpful model quickly becomes an unreadable web of states and transitions. This phenomenon—known as state explosion—occurs when every combination of conditions is represented as a separate state.
For testers, this leads to bloated test matrices, duplicated scenarios, and an increased risk of both gaps and redundancies in test coverage. This “state explosion” problem is easily understood if you consider a system with 10 variables, each with 2 possibilities, which creates 2^10 or 1024 possible states. “For a tester, 1024 states doesn’t just mean a messy diagram; it means a test matrix that is impossible to execute in a single sprint. Hierarchy is our way of performing ‘logical pruning’ without losing coverage.”

Hierarchical state diagrams address this problem by introducing structure. Instead of representing every possible combination explicitly, hierarchy allows testers to group related states, share common transitions, and reason about behavior at multiple levels of abstraction. High-level states describe major system modes, while nested states capture the detailed behavior that only applies within those modes. The result is a model that scales with system complexity without overwhelming the people who need to test it.
By using hierarchical state diagrams, testers can focus on what varies and what stays the same, reduce unnecessary duplication, and regain confidence that complex behavior is both understandable and testable.
What is a hierarchical state diagram, how and when do we use them, and how is it different than flat state diagrams
What is a Hierarchical State Diagram?
A Hierarchical State Diagram, introduces the concept of “nesting.” It allows you to group related states into a single Superstate, or Composite State. If a system is in a “substate,” it is automatically also in the “superstate.” This allows you to define behaviors once for the group rather than repeating them for every individual state.
Key Elements:
- Superstate (Composite State): A high-level state that contains other states.
- Substate: A state contained within a superstate.
- History States: A marker ($H$) that allows the system to “remember” which substate it was in before a transition took it out of the superstate. This becomes important, for example, when testing a mobile app and I am in the middle of a “Transfer Funds” workflow and get a phone call:
- No History: I go back to the “Main Menu.”
- History ($H$): I go back to the “Transfer Funds” screen I was just on.
- “History State” is potentially a requirement that needs to be verified.
- Generalized Transitions: A single arrow leaving a superstate that applies to all substates within it (e.g., a “Power Off” button works whether you are in “Settings” or “Live Play”).
Flat vs. Hierarchical: The Difference
The primary difference is abstraction.
- Redundancy: In flat diagrams, if 5 states all transition to “Error” on the same trigger, you need 5 separate arrows. In hierarchical diagrams, you put those 5 states in a “Processing” superstate and draw one arrow to “Error.”
- Readability: Flat diagrams suffer from State Explosion, where the number of transition lines grows exponentially, leading to “spaghetti diagrams.” Hierarchical diagrams “tame” this by hiding detail until you need it.
- Inheritance: Substates “inherit” the transitions of their parent superstate.
An example: ATM machine state diagrams
To design a state diagram representing the states, events and transitions for an ATM, there is a lot to account for. We have to account for happy paths (like getting cash) and the alternate or error paths (invalid PINs, hardware failures, or timing out). Our ATM diagram has three primary super states:
- Out of Service – which could result from being out of cash or a mechanical jam
- Maintenance Mode – Entered via Tech login to service the ATM, including cash replenishment or repairs as needed
- In Service – the primary operational mode that allows customers to perform transactions like checking balance, transferring money, and withdrawing cash.
Breaking down In-Service more nets groupings of states, transitions, and events as follows:
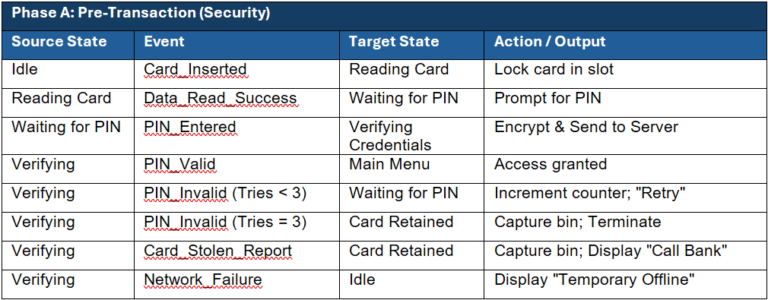
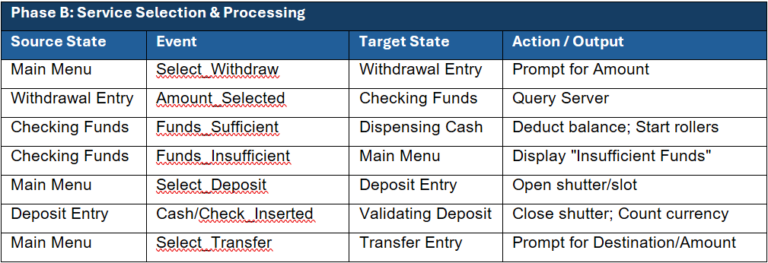
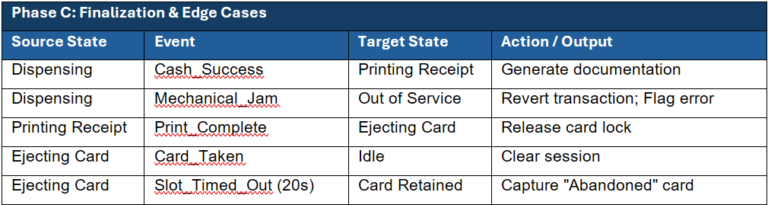
A summary of our State Transitions Matrix:
- Note on Global Transitions: Any state within the “In Service” hierarchy is subject to the Session Timeout and Cancel triggers.
- To Out of Service: Triggered by
Mechanical_JamorCash_Emptyfrom any active dispensing or idle state. - To Card Retained: Triggered by
Card_Stolen_Report,3x Invalid PIN, orSlot_Timed_Out(Abandoned Card). - To Ejecting Card: Triggered by
Cancel_Pressedor successful completion ofPrinting Receipt.
Below is the flat model representing our ATM system requirements as described. We should note that every single substate (PIN Entry, Selection, Dispensing) would need a transition line pointing to “Out of Service” in case the power fails or a sensor jams.
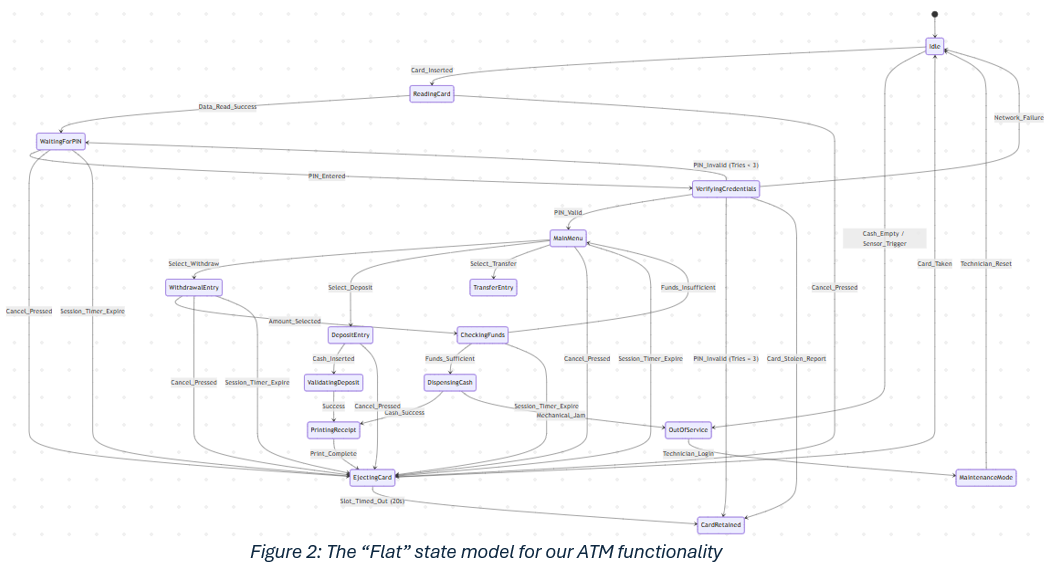
In a Hierarchical Model, we simply draw one transition from the boundary of the In Service superstate to the Out of Service state. If the hardware fails, it doesn’t matter if the user was typing their PIN or choosing an amount; the system handles the failure at the highest level, safely cancels the session, and shuts down.

When to Use Hierarchical Models
- When you have “Global” triggers: If a “Cancel” or “Reset” button should work at any point during a multi-step process.
- When states share properties: If “Validating Card,” “Processing Payment,” and “Updating Ledger” all need to handle a “Connection Lost” event.
- When you need to Manage Complexity: When a flat diagram no longer fits on a single screen or page without looking like a ball of yarn.
Advantages/disadvantages
The key advantage to Hierarchical diagrams is that they help us manage complexity by reducing the number of states shown at one level and reducing the number of transitions, making the diagram easier to understand and maintain.
From a testing perspective, in a hierarchical state diagram, the test matrix becomes significantly more efficient. Instead of a massive, flat spreadsheet where you attempt to cross-reference every state with every event, you can break your testing strategy into layers.
This approach, often called Layered Test Derivation, ensures you don’t waste time testing the same “global” logic fifty times. Creating a test matrix from Hierarchical States involves the following steps:
- Level 1: Superstate (Inter-state) Matrix
Focus on the transitions between the high-level containers. At this level, you treat the Superstate as a “black box.”
Goal: Verify the system moves correctly between major modes (e.g., In Service to Out of Service). - Level 2: Substate (Intra-state) Matrix
Now, “zoom in” to a specific Superstate and map the logic inside it.
Goal: Verify the specific business logic of a feature. - Level 3: History and Boundary Matrix
Test the “memory” of the hierarchy.
Goal: Ensure the system handles interruptions correctly.
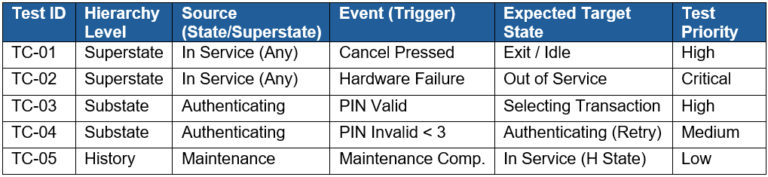
Your resulting Test Matrix might look like this:
Not a disadvantage, but something to keep in mind, is that Hierarchy is not going to remove the need for nor reduce tests for coverage. It changes how the model is organized for clarification. Your test matrix will be more efficient as you are able to break testing into layers and are to reduce test redundancy because you are no longer testing the same global logic many times.
How to transition our overly complex Flat State models to Hierarchical state models
Moving from a flat diagram to a hierarchical one is essentially an exercise in refactoring. Just as you refactor code to remove duplication, you refactor a state diagram to remove redundant transitions. For a software tester, this process is invaluable because it reveals the “global rules” of the system that might have been buried under a mountain of arrows. The steps are as follows:
- Identify Common Triggers (The “Cleanup” Phase)
Look at your flat diagram and find events that lead to the same destination from multiple states.
Example: In the ATM flat diagram, almost every state had an arrow pointing to Out of Service triggered by Hardware Failure.
The Goal: Find the “Global Interrupts” (Cancel, Power Off, Error, Timeout). - Group Related States into Superstates
Look for states that share a common context or “lifecycle phase.”
Clustering: Group states like Entering PIN, Selecting Amount, and Processing into a single container called Active Session.
Logic: Ask yourself, “Is the system ‘In’ a specific mode during all of these steps?” If yes, that’s your Superstate. - Elevate Transitions to the Superstate Boundary
This is where the magic happens as “Inheritance is the secret to reducing redundancy.”
Action: Take those common transitions identified in Step 1 and move them. Instead of drawing 5 arrows from 5 substates to an Error state, draw one arrow from the outer border of the new Superstate to the Error state.
Result: You have just mathematically reduced the complexity of the diagram while maintaining the exact same logic. - Define Entry and Exit Behaviors
Once you have your Superstate, decide how the system should behave when it enters or leaves that “bubble.”
Initial State: Which substate does the system default to when entering the superstate? (e.g., When the ATM goes In Service, it always starts at Idle).
History ($H$): If an interrupt occurs (like a phone call on a mobile app), should the system return to the start of the superstate or remember exactly where the user left off?
Why this helps the Tester
By following these steps, you create a Test Hierarchy. You can now separate your test plan into:
• High-Level Tests: Does the “Cancel” button work regardless of what the user is doing? (Superstate testing).
• Deep-Logic Tests: Does the “Withdraw” amount correctly decrement the balance? (Substate testing).
Conclusion
A hierarchical state diagram decomposes states into superstates and substates to reduce complexity and duplication, allowing common transitions and actions to be defined at a higher level for use in state transition testing. It’s a tool that helps us solve the state explosion problem and better represent complex system behaviors to improve ability to identify issues in behavior definition and improves analysis for testing.