The use of Artificial Intelligence (AI) in software development is rapidly increasing. The emergence of AI-powered development tools like GitHub Copilot has sparked both excitement and questions. One of the biggest questions for leaders is what is the ROI of AI?
Copilot uses artificial intelligence to provide code suggestions and completions in real-time, potentially transforming the way software developers work. Recent studies have shown that AI assistants, such as GitHub Copilot, increase developer productivity by between 20% and 50%, depending on the software task, the developer's level of experience, the type of software being developed, and the amount of training and coaching provided to developers.
Measuring the value and return on investment of GitHub Copilot is crucial as organizations make financial decisions about ongoing investments in GitHub Copilot at each stage of the adoption process. In general, there are four stages to Copilot adoption:
- Onboarding: Evaluate business and technical case to adopt Copilot throughout the organization
- Adoption: Teams are enabled and actively using Copilot
- Optimization: Positive impact on organization-specific goals
- Sustained Efficiency: Continuous evaluation and improvement of Copilot usage
Leading vs Lagging Indicators
To determine what metrics make the most sense to use across these stages, it is productive to separate leading from lagging indicators of improvement.
Leading indicators are metrics used to predict future trends or improvements. These metrics are typically a combination of qualitative and quantitative and focus on the day-to-day outcomes of using Copilot. They provide foresight and can help anticipate what might happen as Copilot is adopted and optimized.
Lagging indicators are metrics that reflect past performance or events. These metrics are typically tied to your organizational goals such that a return on investment (ROI) can be calculated for adopting Copilot. They confirm trends that have already occurred and show improvements that have been realized against your specific business objectives.
While applying Copilot metrics successfully is situational, there are some best practices to follow.
Use leading indicator metrics during Evaluation and Adoption.
When assessing whether to initially invest in or to scale Copilot, leading indicators are best to measure. There are several reasons for this.
- Leading metrics can mostly be automatically calculated as a side effect of day-to-day use of Copilot. This makes them easy to collect and use for decision-making, and
- There will not be enough data on using Copilot to collect lagging metrics during these stages. Without enough data, lagging metrics will not be useful.
For Copilot, leading indicators are collected and aggregated from individual users. These metrics are closely aligned with day-to-day software delivery practices and rely on a combination of self-reported data from developers and existing GitHub telemetry (data collected from GitHub platforms). Employing this approach makes it possible to both (a) reliably predict future impact, and (b) perform an evaluation with relatively little additional investment in observability.
Here are three critical categories of leading metrics:
- Copilot usage statistics
- Active users: The number of developers using Copilot.
- Percentage of developers using Copilot regularly: Shows the breadth of adoption within the team or organization.
- Frequency of usage: Metrics like the average number of suggestions accepted per user per day or week. Also the percentage of accepted suggestions against total suggestions made
- Copilot impact on development workflow and results
- Pull Requests: Metrics like the number of pull requests, time to merge, and the size of pull requests could indicate whether Copilot is enabling faster or more frequent code reviews.
- Build Frequency: If Copilot helps developers write code more quickly or with fewer errors, build frequency might increase due to more rapid iterations.
- Commits: Increased commits could suggest more granular changes, which might be facilitated by Copilot's assistance.
- Developer satisfaction with Copilot
- Satisfaction surveys: Create two surveys for Copilot users to provide their feedback. One should be lightweight and simple to encourage weekly feedback. An example of a lightweight survey question might be: "How satisfied were you with Copilot this week (1-5)?" The other survey should be more extensive but only used at the end of an adoption step to collect information needed to make a financial decision. An example of a detailed survey question might be: "What are the specific tasks where Copilot helped or hindered your workflow?"

Use lagging indicator metrics during Optimization and Sustained Efficiency.
Once Copilot adoption is accelerating toward full adoption, lagging indicators should be defined to justify ongoing Copilot investment and improvement. While these metrics are typically business-oriented and situational, there are some key business goals that should be considered:
- Software development goals
- Faster software delivery timelines
- Higher code quality during SDLC (fewer bugs, less technical debt)
- Increased developer satisfaction and retention
- Reduced development costs
- Faster onboarding of new engineers
- Software product goals
- Reduce time-to-market
- Risk mitigation around product quality and security
- Increases in developer productivity
- Reduced software development costs
- Customer satisfaction
The key to effectively measuring these lagging, business-oriented goals is to appropriately align leading indicators to business goals. There are numerous frameworks available for performing this alignment, including Goal, Question, Metric (GQM), which walks software leaders through the following steps:
- Determine your highest priority goals. Keep the list small to make your effort tractable. Any more than 3-4 goals is too much
- Examine each priority goal and determine what questions must be answered to assess how close to achieving the goal your organization is
- Determine which GitHub Copilot leading indicators metrics best answer these questions
An example of aligning GitHub Copilot metrics with a business goal would be:
Goal: Reduce Time to Market
Question: Are our release cycles faster?
Metrics: Time to merge of a pull request, lead time for changes, number of commits, build frequency
Use built-in GitHub and GitHub Copilot Telemetry and Data.
All of the quantifiable leading indicators can be automatically collected from a combination of the GitHub repositories associated with software projects/products, leveraging GitHub Copilot and GitHub Copilot telemetry accessible through published GitHub Copilot APIs. As lagging indicators also leverage leading indicators in a GQM process, this information also partially supports the collection of lagging indicators.
More information on GitHub Copilot APIs can be found below:
GitHub Copilot User Management API
GitHub Actions for Collecting GitHub Copilot Information
Examples of collecting various GitHub repository metrics can be found below:
[Example GitHub Copilot Developer Satisfaction Survey](http://GitHub Copilot developer satisfaction survey)
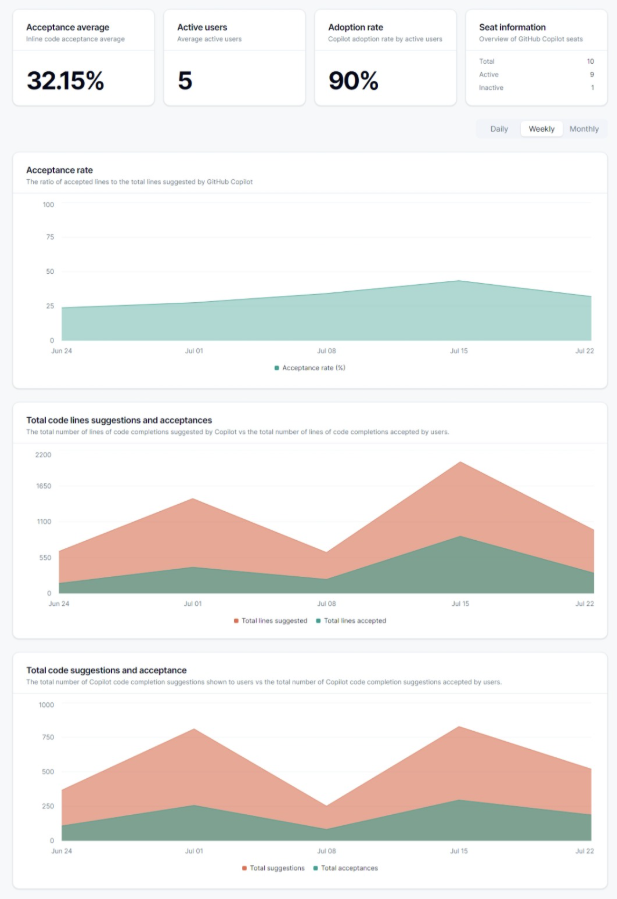
Make your metrics visible.
Collecting metrics for evaluating value is important but only useful if you can see those metrics and track them over time. This also provides a way to share improvements with development teams and that will increase adoption. The best way to make your metrics visible is to build and share a dashboard showing results. There are numerous example dashboards available on GitHub for you to start from. Here is one to consider:
Don't ignore challenges.
Measuring the impact of GitHub Copilot is not without its hurdles. One significant challenge lies in isolating Copilot's influence from other factors that may affect developer productivity or code quality. It can be difficult to definitively say that a change is solely due to Copilot and not influenced by other training, new processes, or external variables. Another challenge is defining clear baselines for comparison. Without a solid understanding of pre-Copilot performance metrics, it becomes harder to assess the extent of the tool's impact. Furthermore, accurate tracking of Copilot's usage and effectiveness requires a considerable time investment, likely several weeks of part-time effort from a data analyst, which may strain resources. Lastly, the subjectivity inherent in qualitative feedback poses a challenge. Developer perceptions of Copilot's benefits can vary, and it can be difficult to translate these individual experiences into objective, measurable data.